Documentation
Everything you need to know about PrettyLogs - from installation to advanced usage patterns.
Installation
Install PrettyLogs using your preferred package manager:
npm install @millosaurs/prettylogsyarn add @millosaurs/prettylogspnpm add @millosaurs/prettylogsbun add @millosaurs/prettylogsQuick Start
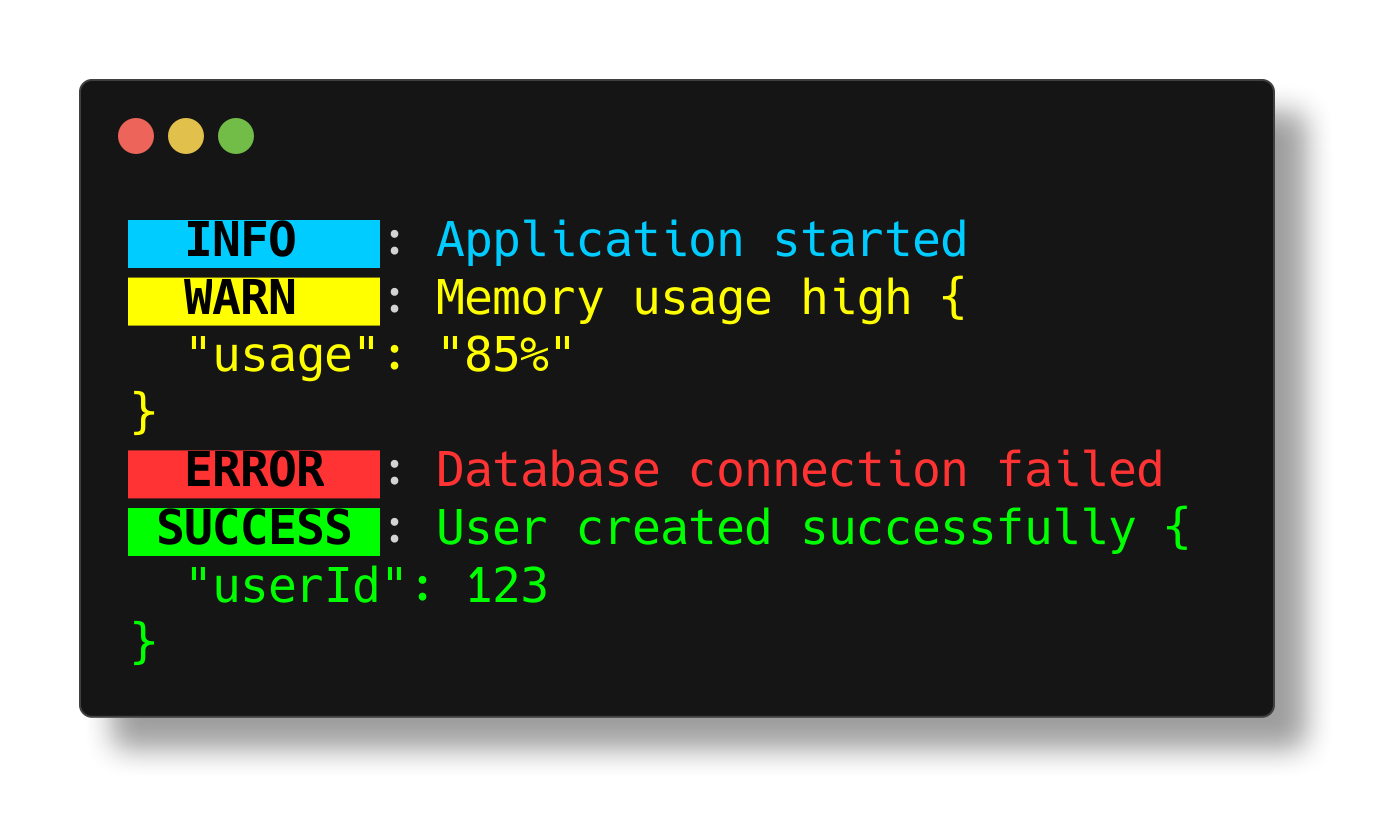
Get up and running with PrettyLogs in seconds. Here's the simplest way to start logging:
import PrettyLogs from '@millosaurs/prettylogs';

const logger = new PrettyLogs();

logger.info('Application started');
logger.success('Database connected');
logger.warn('Cache miss for key: user_123');
logger.error('Failed to process payment', { orderId: '12345' });
💡 Tip: PrettyLogs works out of the box with zero configuration, but offers extensive customization options when you need them.
Log Levels
PrettyLogs supports multiple log levels, each with distinct visual styling for easy identification:
tracedebuginfosuccesswarnerrorfatallogger.trace('Entering function processData()');
logger.debug('Variable state:', { count: 42 });
logger.info('Request received from 192.168.1.1');
logger.success('Email sent successfully');
logger.warn('API rate limit at 80%');
logger.error('Database connection failed');
logger.fatal('Critical system failure - shutting down');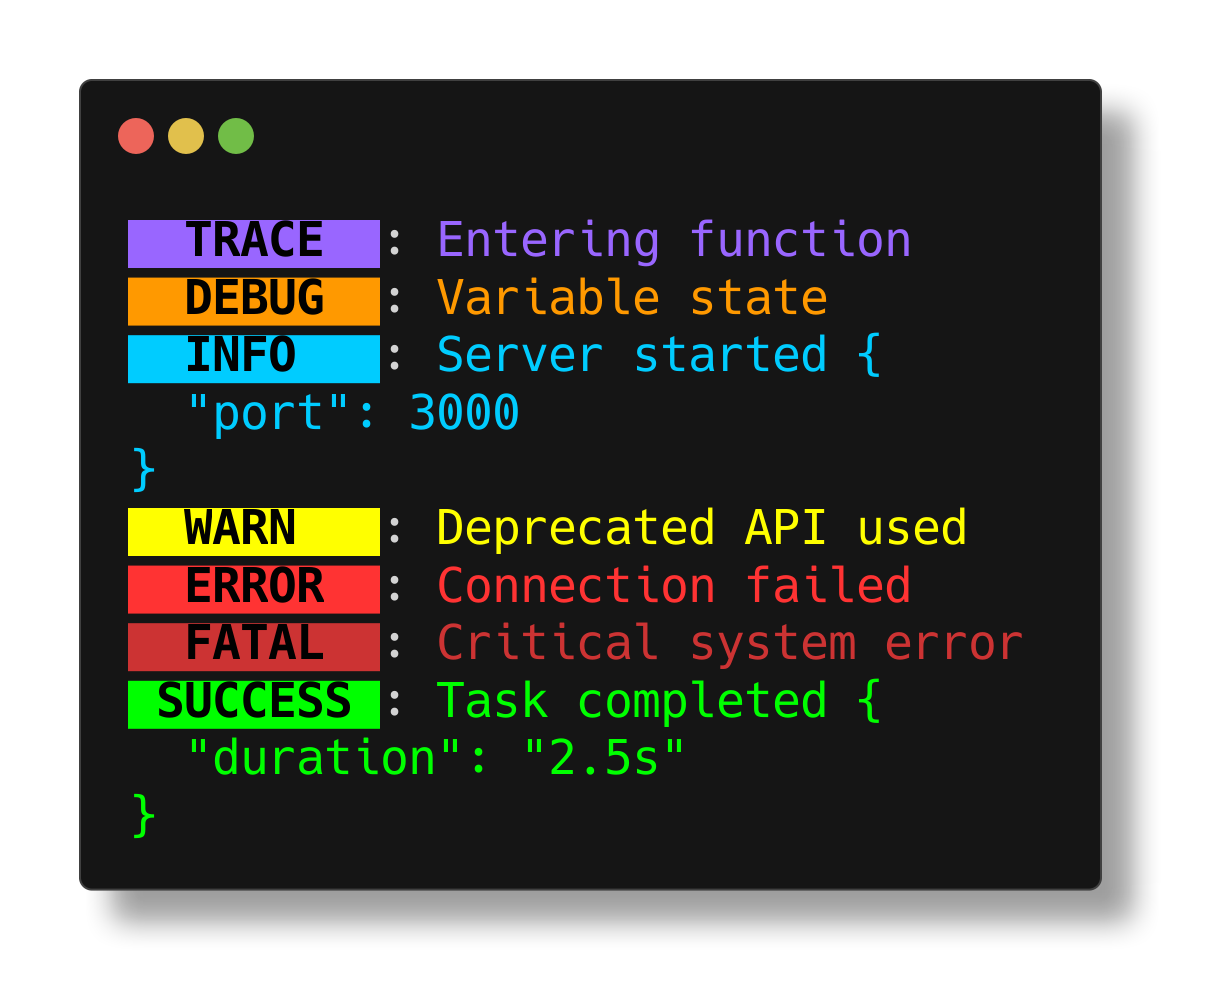
Configuration
Customize PrettyLogs to match your application's needs with extensive configuration options:
const logger = new PrettyLogs({
  level: 'info',                    // Minimum log level to output
  name: 'MyApp',                    // Logger name/identifier
  showTimestamp: true,              // Show timestamps
  showLevel: true,                  // Show log level
  showName: true,                   // Show logger name
  timestampFormat: 'HH:mm:ss',      // Timestamp format
  colors: true,                     // Enable colors
  structured: false,                // Output structured JSON
  fileLogging: {
    enabled: true,
    directory: './logs',
    filename: 'app.log',
    maxSize: 10 * 1024 * 1024,     // 10MB
    maxFiles: 5,
    compress: true
  }
});levelMinimum log level to output. Logs below this level are ignored.
nameLogger name displayed in output. Useful for identifying different parts of your application.
colorsEnable or disable colored output in the console.
showTimestampInclude timestamps in log output.
structuredOutput logs as structured JSON instead of pretty-printed format.
Child Loggers
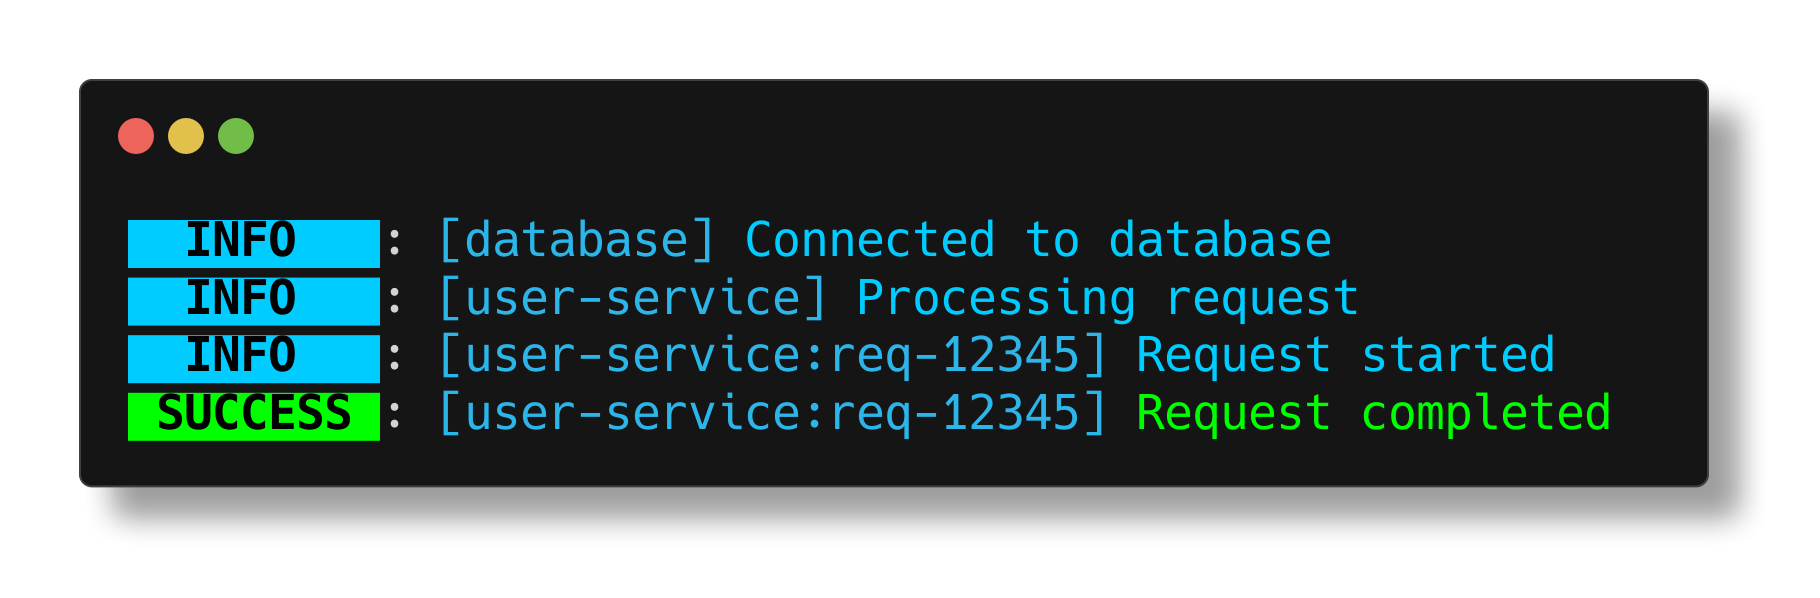
Create child loggers to organize logs from different modules or components while inheriting parent configuration:
// Parent logger
const logger = new PrettyLogs({ name: 'MyApp' });

// Child loggers inherit parent config
const dbLogger = logger.child({ name: 'Database' });
const apiLogger = logger.child({ name: 'API' });
const authLogger = logger.child({ name: 'Auth' });

dbLogger.info('Connection pool initialized');
apiLogger.warn('Rate limit approaching');
authLogger.success('User authenticated');
Benefits of Child Loggers:
- • Share configuration across modules
- • Filter logs by component name
- • Maintain consistent formatting
- • Easy debugging and troubleshooting
File Logging
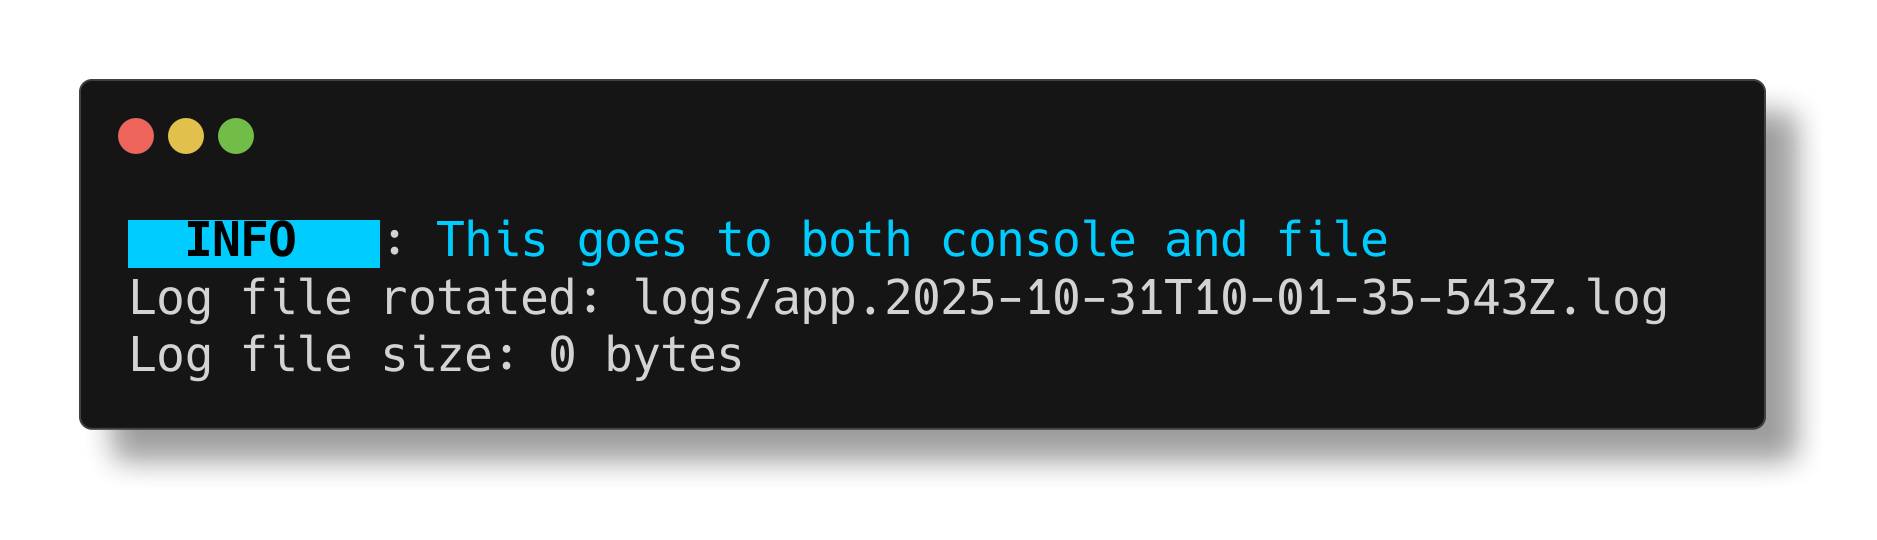
Enable persistent logging to files with automatic rotation, compression, and cleanup:
const logger = new PrettyLogs({
  fileLogging: {
    enabled: true,
    directory: './logs',
    filename: 'app.log',
    maxSize: 10 * 1024 * 1024,     // 10MB per file
    maxFiles: 5,                    // Keep 5 files
    compress: true,                 // Compress old logs
    level: 'debug',                 // Log everything to file
  }
});

// Logs go to both console and file
logger.info('This appears in console and file');
logger.error('Errors are always logged to file');
Automatic Rotation
Files automatically rotate when they reach the maximum size, keeping your logs organized and manageable.
Compression
Old log files are automatically compressed to save disk space while maintaining accessibility.
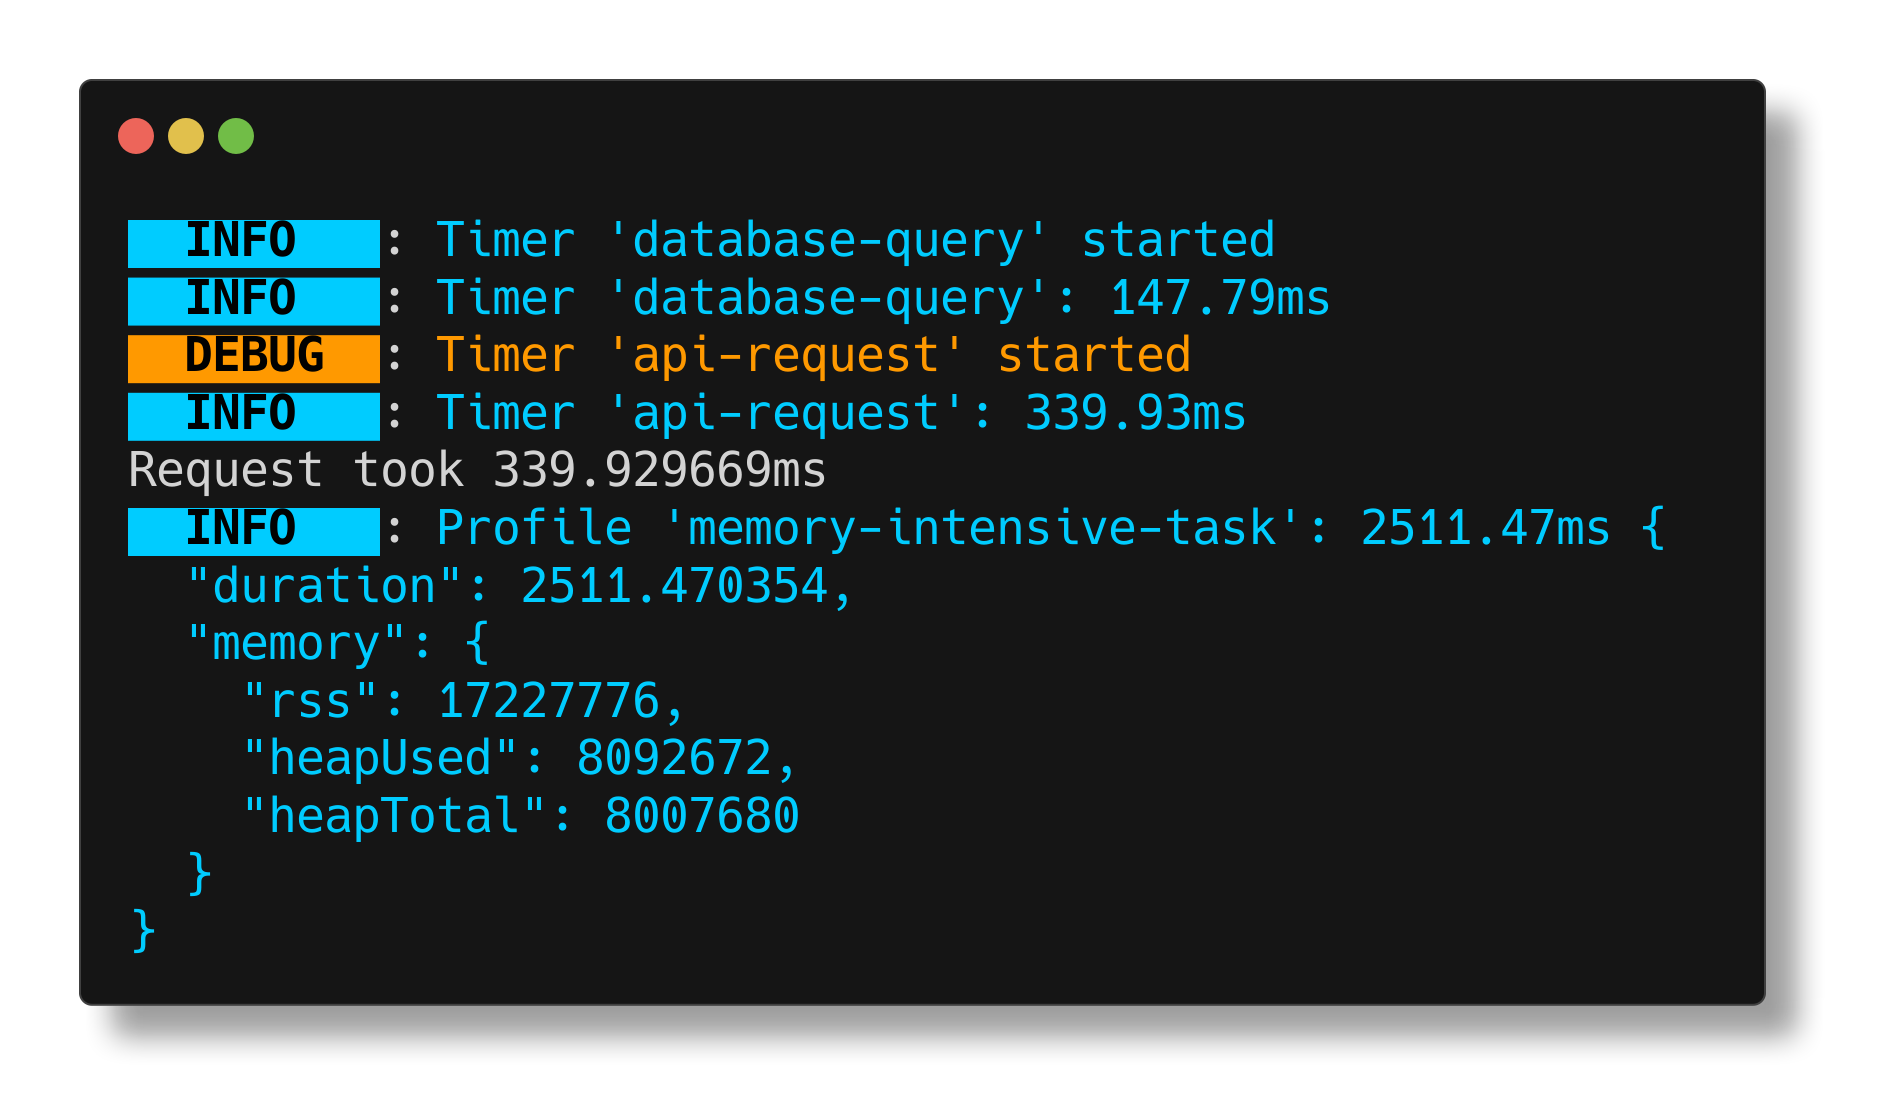
Performance Monitoring
Measure execution time of operations with built-in performance tracking:
// Start a timer
logger.time('database-query');

// ... your code here ...
await db.query('SELECT * FROM users');

// End timer and log duration
logger.timeEnd('database-query');
// Output: ⏱️  database-query: 145ms

// Time async operations
async function processData() {
  logger.time('data-processing');

  await fetchData();
  await transformData();
  await saveData();

  logger.timeEnd('data-processing');
}
💡 Pro Tip: Use performance monitoring to identify bottlenecks in your application. The timer labels help you track different operations independently.
Rich Output
Log complex data structures with beautiful, readable formatting:
// Log objects with pretty formatting
logger.info('User data:', {
  id: 123,
  name: 'John Doe',
  email: 'john@example.com',
  preferences: {
    theme: 'dark',
    notifications: true
  }
});

// Log arrays
logger.debug('Active connections:', [
  { id: 1, ip: '192.168.1.1' },
  { id: 2, ip: '192.168.1.2' }
]);

// Log errors with stack traces
try {
  throw new Error('Something went wrong');
} catch (error) {
  logger.error('Operation failed:', error);
}
Objects
Nested objects are pretty-printed with proper indentation
Arrays
Arrays are formatted for easy scanning and readability
Errors
Full stack traces with highlighted error messages
Production Setup
Recommended configuration for production environments:
const logger = new PrettyLogs({
  level: process.env.LOG_LEVEL || 'info',
  name: process.env.SERVICE_NAME || 'app',
  colors: process.env.NODE_ENV !== 'production',
  structured: process.env.NODE_ENV === 'production',
  fileLogging: {
    enabled: true,
    directory: process.env.LOG_DIR || './logs',
    filename: `${process.env.SERVICE_NAME || 'app'}.log`,
    maxSize: 50 * 1024 * 1024,      // 50MB
    maxFiles: 10,
    compress: true,
    level: 'debug'                   // Log everything to file
  }
});

// Log unhandled errors
process.on('uncaughtException', (error) => {
  logger.fatal('Uncaught exception:', error);
  process.exit(1);
});

process.on('unhandledRejection', (reason) => {
  logger.error('Unhandled rejection:', reason);
});
Environment Variables
Use environment variables for flexible configuration:
LOG_LEVEL=info
SERVICE_NAME=api-server
LOG_DIR=/var/log/myapp
NODE_ENV=production
TypeScript Support
PrettyLogs is written in TypeScript and provides full type definitions out of the box:
import PrettyLogs, { LogLevel, LoggerConfig } from '@millosaurs/prettylogs';

// Type-safe configuration
const config: LoggerConfig = {
  level: 'info' as LogLevel,
  name: 'MyApp',
  colors: true
};

const logger = new PrettyLogs(config);

// All methods are fully typed
logger.info('Message', { key: 'value' });
logger.child({ name: 'SubModule' });

// Custom type definitions
interface UserEvent {
  userId: string;
  action: string;
  timestamp: Date;
}

function logUserEvent(event: UserEvent) {
  logger.info('User event:', event);
}
✨ Full IntelliSense Support: Get autocomplete, type checking, and inline documentation in your IDE for all PrettyLogs features.
API Reference
Complete reference for all PrettyLogs methods and options:
constructor
new PrettyLogs(config?: LoggerConfig)Create a new logger instance with optional configuration.
trace
logger.trace(message: string, ...args: any[])Log a trace-level message with optional arguments.
debug
logger.debug(message: string, ...args: any[])Log a debug-level message with optional arguments.
info
logger.info(message: string, ...args: any[])Log an info-level message with optional arguments.
success
logger.success(message: string, ...args: any[])Log a success message with optional arguments.
warn
logger.warn(message: string, ...args: any[])Log a warning message with optional arguments.
error
logger.error(message: string, ...args: any[])Log an error message with optional arguments.
fatal
logger.fatal(message: string, ...args: any[])Log a fatal error message with optional arguments.
child
logger.child(config: Partial<LoggerConfig>)Create a child logger that inherits configuration from the parent.
time
logger.time(label: string)Start a timer with the given label for performance monitoring.
timeEnd
logger.timeEnd(label: string)End a timer and log the elapsed time.
Need More Help?
Check out our GitHub repository for examples, issues, and contributions:
View on GitHub